
Weather Data Calculation
Air Density
Air Density (the weight of 1 cubic foot or 1 cubic meter of air ) is a valuable tool for racing enthusiasts, because it helps determine the optimal jetting under current weather conditions.
Note: Air density calculations for Monitor and Perception stations uses the uncorrected bar value. Air density calculations for Vantage Pro and Vantage Pro2 stations use the corrected/final bar value.
Note: Vantage Pro, Vantage Pro2, and Monitor stations only support air density html tags. Air density calculations are not available for plotting or for display in the browse window.
Internal combustion engines operate at their peak efficiency (producing the most power or using the least fuel) when the correct ratio of oxygen and fuel are introduced into the combustion chamber. The carburetor jets (or fuel injector setting) control the ratio of how much fuel is introduced into a given airflow. Carburetors do not automatically compensate for changes in the amount of oxygen in that airflow and therefore changes in oxygen concentrations can result in inefficient operation. Changes in the oxygen content of air result from changes in the weather (barometric pressure, temperature, and humidity).
Measuring oxygen concentration in air is difficult; other measures are commonly used to estimate oxygen content. For example, determining changes in the density of the air (i.e., how much a given volume of air weighs) can produce a reasonable estimate of changes in oxygen concentration.
The formula used to calculate air density in the WeatherLink Software requires measures of absolute pressure (barometric pressure uncorrected for altitude), relative humidity, and temperature.
Air Density (in Kg/m3) = 1.2929 X 273.13 X ( AP - ( SVP x RH ))
( T + 273.13) 760
Where:
T = Temperature in Celsius
AP = Absolute Pressure (mm of Hg)
SVP = Saturation Vapor Pressure of air over water at temp T (see Table 1 below)
RH = Relative Humidity (decimal)
Table 1. Saturation Vapor Pressure at Different Temperatures

One must develop "rules of thumb" to use air density effectively in tuning carburetors for optimal performance. One such rule of thumb is that a five percent (5%) change in air density may require re-adjustment of the carburetor jetting. High air density readings indicate more oxygen in the air, thus more fuel is needed (richer tune), while low readings indicate less oxygen, requiring less fuel (leaner tune).
Average and High Wind Speeds
WeatherLink samples the wind speed reading from the station a number of times during the interval (the actual number depends on your archive interval). Those readings are averaged to determine at the average wind speed for the interval. WeatherLink accumulates the following wind speed statistics for each minute (as determined by the computer clock): The number of data points received, the highest wind speed value, and the sum of all of the wind speed values received. These statistics are kept for the last full 10 minutes, plus the last minute that is currently being updated.
The average and high wind values are calculated by aggregating the last X minute statistics, plus the statistics for the current minute. For example, the two minute high wind speed is the highest value recorded in the last two full minutes plus the current minute divided by the number of samples over the same period.
Note: Because the average is calculated by the computer, the value is shown with a resolution of 0.1 mph (0.1 km/h, 0.1 knots, or 0.1 m/s). This is different from the 10 minute average wind speed available on the Vantage Pro or Vantage Pro2 station, which is available as soon as a real -time window (excluding the Strip Chart) is open, but only has a resolution of whole miles per hour. Once 10 minutes have passed these two values should be within 1 mph of each other.
Because the current partial minute is included in the calculation, the numbers can change with every sample taken, and the time periods are not exactly the number of minutes specified. For example, the two minute wind values are calculated over a period between two and three minutes depending on the time between when the value is calculated and the time the computer clocked rolled over to a new minute.
The wind data table in Summary window will show dashes until the number of minutes specified have elapsed. For example, at least five minutes must elapse after opening a real time window before the five minute average or high wind speed are shown.
Note: The one minute data will be shown when the computer clock rolls over to a new minute which will occur less than a minute after the window is opened. This "error" becomes a smaller percentage of the measurement interval over longer time intervals, and disappears completely after 11 minutes.
Bad Data
Should a sensor get disconnected or malfunction, or the wireless model loses reception, the software displays any "bad data" recorded by that sensor as dashes (--). When you create a plot, the software ignores bad data and skips that point on the plot. You can enter dashes (--) into the database using the database record editor to mark bad data points as well.
Note: A dashed wind direction reading usually means there is no wind speed, but can also indicate bad or missing data.
Bar Trend
The Bar Trend shows the direction of change (higher, lower, steady) of the barometric pressure over the last three hours.
- The Bar Trend is updated every 15 minutes.
- Rapid rise is indicated if the pressure increases >= 0.06"
- Slow rise is indicated if the pressure increases >= 0.02" and < 0.06"
- Steady is indicated if the pressure changes < 0.02"
- Slow fall is indicated if the pressure decreases >= 0.02" and < 0.06"
- Rapid fall is indicated when the pressure decreases >= 0.06"
Note: Your Vantage Pro or Vantage Pro2 console must have Rev B or newer firmware to show the Bar Trend. If your console has Rev A firmware the Bar Trend will show three dashes "---".
Barometric Pressure
The weight of the air that makes up our atmosphere exerts a pressure on the surface of the earth. This pressure is known as atmospheric pressure. Generally, the more air above an area, the higher the atmospheric pressure. This, in turn, means that atmospheric pressure changes with altitude. For example, atmospheric pressure is greater at sea-level than on a mountaintop. To compensate for this difference in pressure at different elevations, and to facilitate comparison between locations with different altitudes, meteorologists adjust atmospheric pressure so that it reflects what the pressure would be if measured at sea-level. This adjusted pressure is known as barometric pressure.
Barometric pressure changes with local weather conditions, making barometric pressure an important and useful weather forecasting tool. High pressure zones are generally associated with fair weather, while low pressure zones are generally associated with poor weather. For forecasting purposes, the absolute barometric pressure value is generally less important than the change in barometric pressure. In general, rising pressure indicates improving weather conditions, while falling pressure indicates deteriorating weather conditions.
Vantage Pro and Vantage Pro2 stations measures atmospheric pressure. When you enter your location’s altitude, Vantage Pro calculates the necessary conversion factor to consistently translate atmospheric pressure to the corrected sea–level barometric pressure for display. You can then fine-tune your barometric pressure reading by entering a new barometer reading in the set barometer dialog box.
WeatherLink for Vantage Pro and Vantage Pro2 samples the barometric pressure every 15 minutes.
WeatherLink for the Monitor, Wizard and Perception samples the barometric pressure at the time of each data archive and writes that value into the archive record.
Degree-Day Calculation Methods
- High / Low method
If you select the high/low method, the software uses the highest temperature and the lowest temperature for a given day to calculate the average temperature for that day. The difference between the average temperature and the base threshold are assumed to be the number of degree-days accumulated on that day. For example, if the average of the highest and lowest temperatures is 24º above the base threshold, the software assumes 24 degree–days for the entire day.
Note: Unless 15 hours worth of records exist in the database for that day (from midnight to 3pm, for example), the software will not calculate degree-days for that day.
- Integration method
If you select the integration method, the software calculates degree–days using the average temperature for an interval and the interval time. For example, if the average temperature during a 15 minute interval was 24º above the base threshold, the software would calculate 0.25 degree-days during that interval (24 * 15 minutes in interval/1440 minutes per day). The number of degree-days during each interval are added together to arrive at a degree-day total. This method calculates degree-day totals more accurately than the high/low method.
Dew Point
Dew-point is the temperature to which air must be cooled for saturation (100% relative humidity) to occur, providing there is no change in water content. The dew-point is an important measurement used to predict the formation of dew, frost, and fog. If dew-point and temperature are close together in the late after noon when the air begins to turn colder, fog is likely during the night. Dew-point is also a good indicator of the air’s actual water vapor content, unlike relative humidity, which takes the air’s temperature into account. High dew-point indicates high vapor content; low dew-point indicates low vapor content. In addition a high dew-point indicates a better chance of rain and severe thunder storms. You can even use dew-point to predict the minimum overnight temperature. Provided no new fronts are expected overnight and the afternoon Relative Humidity ³ 50%, the afternoon’s dew-point gives you an idea of what minimum temperature to expect overnight, since the air is not likely to get colder than the dew-point anytime during the night.
Dew point is not stored in archive memory or the database. Dew point is calculated whenever it is displayed. If you edit the temperature or humidity value, the dew point will change as well.
Equilibrium Moisture Content (EMC)
Moisture content in wood affects both the size and strength of lumber. If you know the EMC of the storage or manufacturing area (which is derived using temperature and humidity readings), you can also determine the moisture content of the wood stored there.
Forecast
WeatherLink includes two forecast features – a forecast icon and a scrolling text message. Both use the following variables to generate this forecast: barometric pressure, wind speed and direction, rainfall, temperature, humidity, latitude and longitude, and time of year.
Note: The Forecast requires at least three hours of barometric pressure readings and is only available on those stations that include a barometer: the Vantage Pro, Vantage Pro2, Monitor, and Perception.
- Forecast Icon
The icon gives a quick and simple forecast of the weather conditions 12 hours ahead. Based on the variables listed above, the icon will change to show snow, sun, partly cloudy, cloudy, or rain. Remember that the icon does NOT show what’s happening outside at the moment you look, but rather what Vantage Pro/Vantage Pro2 calculates will be the weather in 12 hours.
- Text Forecast
The forecast messages that scroll across the bottom of screen on both Vantage Pro and Vantage Pro2 console, and that appear across the bottom of the WeatherLink Bulletin and Summary windows, provide more detailed forecasts than the forecast icons do. Use the text forecast to help understand what the icons are telling you and as a longer–range forecast. The text forecast will provide information on what could happen up to 48 hours in the future.
Heat Index
The Heat Index uses the temperature and the relative humidity to deter mine how hot the air actually "feels." When humidity is low, the apparent temperature will be lower than the air temperature, since perspiration evaporates rapidly to cool the body. However, when humidity is high (i.e., the air is saturated with water vapor) the apparent temperature "feels" higher than the actual air temperature, because perspiration evaporates more slowly.
Note: WeatherLink uses the Steadman (1979 & 1998) formula to calculate Heat Index, which is more accurate than the method used by the Vantage Pro/Vantage Pro2 consoles and is calculated for all temperatures.
The Heat Index is not stored in archive memory or in the database, rather it is calculated as necessary (for example, when plotting or displaying database information). When Heat Index data is needed, the software calculates an average for each archive interval based on the temperature and humidity readings for the archive period.
Note: Heat Index temperatures greater than 999.9°F cannot be displayed. When the Heat Index temperature exceeds 999.9°F the temp will be dashed out.
Heating & Cooling Degree-Days
Although degree-days are most commonly used in agriculture, they are also useful in building design and construction, and in fuel use evaluation. The construction industry uses heating degree-days to calculate the amount of heat necessary to keep a building, be it a house or a skyscraper, comfortable for occupation. Likewise, cooling degree-days are used to estimate the amount of heat that must be removed (through air-conditioning) to keep a structure comfortable. Heating and cooling degree-days are based on departures from a base temperature, typically 65ºF (18ºC).
One heating degree–day is the amount of heat required to keep a structure at 65ºF when the outside temperature remains one degree below the 65ºF threshold for 24 hours. One heating degree–day is also the amount of heat required to keep that structure at 65ºF when the temperature remains 24ºF below that 65º threshold for 1 hour.
Likewise, one cooling degree–day is the amount of cooling required to keep a structure at 65ºF when the outside temperature remains one degree above the 65ºF threshold for 24 hours. One cooling degree–day is also the amount of cooling required to keep that structure at 65ºF when the temperature remains 24ºF above that 65º threshold for 1 hour.
Depending on the calculation method, both heating and cooling degree-days can accumulate in the same day. Also, note that there are no negative degree-days. If the temperature remains below the threshold, there is no degree-day accumulation.
High and Low Temperatures
WeatherLink is constantly checking for new high and low temperatures. The highest and lowest temperature values recorded during an archive interval are written into archive memory.
High Wind Speed
The WeatherLink is constantly checking for a new high wind speed. The highest wind speed value recorded during the interval gets written into archive memory.
High Rain Rate
Available for Vantage Pro and Vantage Pro2 stations only, the rain rate is calculated by measuring the time interval between each rainfall increment. When there is rainfall within the archive period, the highest measured value is reported. When no rainfall occurs, the rain rate will slowly decay based on the elapse time since the last measured rainfall.
ISS Reception
The ISS Reception rate shows the percentage of wind data packets that have been successfully received by the Vantage Pro or Vantage Pro2 console.
Rainfall
In calculating both daily and yearly rainfall totals for the software, the WeatherLink checks the total rain register on the station. The WeatherLink compares the current total rain value to the previous total rain entry in the archive memory to determine the amount of rainfall that occurred during the interval.
Solar Radiation & Solar Energy
The solar radiation sensor is only available for Vantage Pro and Vantage Pro2 stations.
Solar Radiation
What we call "current solar radiation" is technically known as Global Solar Radiation, a measure of the intensity of the sun’s radiation reaching a horizontal surface. This irradiance includes both the direct component from the sun and the reflected component from the rest of the sky. The solar radiation reading gives a measure of the amount of solar radiation hitting the solar radiation sensor at any given time, expressed in Watts per square meter (W/m2). The value logged by WeatherLink is the average solar radiation measured over the archive interval.
Hi Solar Radiation
This is the peak solar radiation measured during the archive interval.
Note: Vantage Pro consoles with Rev A firmware will only show the average high solar radiation value. Rev B firmware allows the Vantage Pro console to also log the high solar radiation value for each archive period.
Solar Energy
The amount of accumulated solar radiation energy over a period of time is measured in Langleys.
1 Langley = 11.622 Watt-hours per square meter
= 3.687 BTUs per square foot
= 41.84 kilojoules per square meter
Temperature
The Vantage Pro and Vantage Pro2 stations use the ISS’s temperature sensor to measure the outside air temperature. A second temperature sensor in the console measures the inside air temperature. Additional temperature sensors (available only with wireless Vantage Pro and Vantage Pro2 models) can be used to measure temperature in other locations. You may use these extra sensors to measure whatever auxiliary temperature you see fit (including water temperature).
The Vantage Pro/Vantage Pro2 either samples the temperature at the end of the archive period and writes it to the data logger, or samples the temperature throughout the archive period and calculates an average value at the end of the period.
Note: Temperature averaging is available as an option only if the Vantage Pro console firmware is dated 7/18/2002 or later.
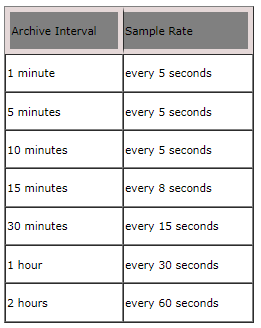
The data logger samples the temperature reading from the station a number of times during the interval and then averages all those readings to arrive at the average temperature for the interval. The number of times the data logger samples the temperature depends on the archive interval.
Temperature Humidity Sun Wind (THSW) Index
The THWS Index uses humidity, temperature, the cooling effects of wind and the heating effects of direct solar radiation to calculate an apparent temperature.
Note: THSW requires a solar radiation sensor. The solar radiation sensor is only available for Vantage Pro/Vantage Pro2 stations.
Note: THSW Index temperatures greater than 999.9°F cannot be displayed. When the THSW Index temperature exceeds 999.9°F the temp will be dashed out.
Temperature Humidity Wind (THW) Index
The THW Index uses humidity, temperature and wind to calculate an apparent temperature that incorporates the cooling effects of wind on our perception of temperature.
Note: THW Index temperatures greater than 999.9°F cannot be displayed. When the THW Index temperature exceeds 999.9°F the temp will be dashed out.
UV Index & UV Dose
Note: The UV sensor is only available for Vantage Pro and Vantage Pro2 stations.
Energy from the sun reaches the earth as visible, infrared, and ultraviolet (UV) rays. Exposure to UV rays can cause numerous health problems, such as sun burn, skin cancer, skin aging, and cataracts, and can suppress the immune system. The Vantage Pro or Vantage Pro2 console can help analyze the changing levels of UV radiation and can advise of situations where exposure is particularly unacceptable.
Caution: The UV readings do not take into account UV reflected off snow, sand, or water, which can significantly increase the amount of UV to which you are exposed. Nor does the Vantage Pro take into account the dangers of pro longed exposure to UV radiation. The readings do not suggest that any amount of exposure is safe or healthful. Do not use the Vantage Pro to determine the amount of UV radiation to which you expose yourself. Scientific evidence suggests that UV exposure should be avoided and that even low UV doses can be harmful.
The console displays UV readings in two scales: UV Index and UV MEDs.
UV Index
The UV Index measures the intensity of UV. It was first defined by Environment Canada and since has been adopted by the World Meteorological Organization. UV Index uses a scale of 0 to 16 to rate the current intensity of UV. The UV value logged by WeatherLink is the average UV measured during the archive interval.
The US EPA categorizes the UV Index values as shown below in Table 1.
Table 1 – UV Index and Exposure Category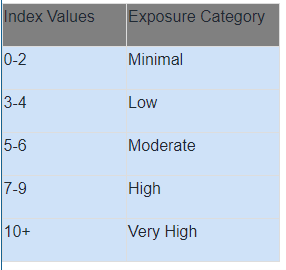
Hi UV Index
This is the peak UV measured during the archive interval.
Note: Vantage Pro consoles with Rev A firmware will only show the daily high UV value.
UV MEDs
MED stands for Minimum Erythemal Dose, defined as the amount of sunlight exposure necessary to induce a barely perceptible redness of the skin within 24 hours after sun exposure. In other words, exposure to 1 MED will result in a reddening of the skin. Because different skin types burn at different rates, 1 MED for persons with very dark skin is different from 1 MED for persons with very light skin.
Both the U.S. Environmental Protection Agency (EPA) and Environment Canada have developed skin type categories correlating characteristics of skin with rates of sunburn. Tables 2 and 3 below list these skin types.
Table 2 – EPA Skin Phototypes
Skin Photo type | Skin Color | Tanning & Sunburn History |
1- Never tans, always burns | Pale or milky white; alabaster | Develops red sunburn; painful swelling, skin peels |
2 – Sometimes tans, usually burns | Very light brown; sometimes freckles | Usually burns, pinkish or red coloring appears; can gradually develop light brown tan |
3 – Usually tans, sometimes burns | Light tan; brown, or olive; distinctly pigmented | Rarely burns; shows moderately rapid tanning response |
4 – Always tans; rarely burns | Brown, dark brown, or black | Rarely burns; shows very rapid tanning response |
Table 3 – Environment Canada Skin Types and Reaction to the Sun
Skin Type | Skin Color | History of Tanning & Sun burning |
I | White | Always burns easily, never tans |
II | White | Always burns easily, tans minimally |
III | Light Brown | Burns moderately, tans gradually |
IV | Moderate Brown | Burns minimally, tans well |
V | Dark Brown | Burns rarely, tans profusely |
VI | Black | Rarely burns; shows very rapid tanning response |
Note: The Vantage Pro/Vantage Pro2 consoles assume a Fitzpatrick (Environment Canada) Skin Type II. WeatherLink uses the skin factor selected in the Set Skin Type Scale Factor command in the Setup menu.
Wind Chill
Wind chill takes into account how the speed of the wind affects our perception of air temperature. Your body warms the surrounding air molecules by transferring heat from your skin. If there’s no air movement, this insulating layer of warm air molecules stays next to your body and offers some protection from cooler air molecules. Wind disperses this layer of warm air, causing the air temperature to "feel" colder. The faster the wind blows, the quicker the layer of warm air is dispersed, and the colder you feel. Above 93.2ºF (34.0ºC), wind movement has no effect on the apparent temperature.
Modified Wind Chill calculations between 40ºF (4.4ºC) and 93ºF (33.9ºC) give more intuitive readings for temperatures above the upper limit of the official wind chill formula (40ºF) The result of this modification is lower wind chill values in the above temperature range than using the official formula.
Wind chill is not stored in archive memory. Wind chill is calculated whenever it is displayed. If you edit temperature or wind speed values, the wind chill will change as well.
Note: WeatherLink versions 5.1 and later use the Osczevski (1995) equation to calculate wind chill. This is the method adopted by the US National Weather Service in September of 2001.
Note: All Monitor, Wizard and Perception consoles, as well as Vantage Pro consoles with firmware dated July 18, 2001 or earlier, all use the previous US National Weather Service wind chill calculation formula: Siple and Passel (1948).
Wind Direction
The WeatherLink samples the wind direction reading a number of times during the interval (the actual number depends on your archive interval). If wind speed is greater than 0 when the WeatherLink samples wind direction, it places a "marker" into one of sixteen "bins" that correspond to the sixteen compass points. At the time of the archive, the WeatherLink determines which bin contains the most markers and writes the corresponding wind direction to the archive memory as the dominant wind direction.
Note: During intervals with very low wind speed, it is possible for no wind direction to be recorded, because wind speed was always 0 when direction was sampled. In this case, wind direction for the interval appears as a pair of dashes (--).
Wind Run
Wind run is measurement of the "amount" of wind passing the station during a given period of time, expressed in either "miles of wind" or "kilometers of wind". WeatherLink calculates wind run by multiplying the average wind speed for each archive record by the archive interval.
For Example:
Average Wind Speed = 5 mph
Archive Interval = 30 minutes (0.5 hours)
Wind Run = 5 mph x 0.5 hours = 2.5 miles of wind
If you are using mph to measure wind speed, wind run will be reported in miles.
If you are using knots to measure wind speed, wind run will be reported in nautical miles.
If you are using km/h to measure wind speed, wind run will be reported in kilometers.
If you are using m/s to measure wind speed, wind run will be reported in kilometers.
Wind Speed
The WeatherLink samples the wind speed reading from the station a number of times during the interval (the actual number depends on your archive interval). Those readings are averaged to determine at the average wind speed for the interval.
The Vantage Pro/ Vantage Pro2 stations measures wind speed and the direction from which it’s blowing. The ten-minute average wind speed is displayed in the weather ticker whenever wind is selected.